Pull data via Spikeet Data Platform
Input your criteria to pull historical data into spreadsheets, with our no-code platform.
You can now streamline historical charts for your data scans. It's done automatically with Spikeet!
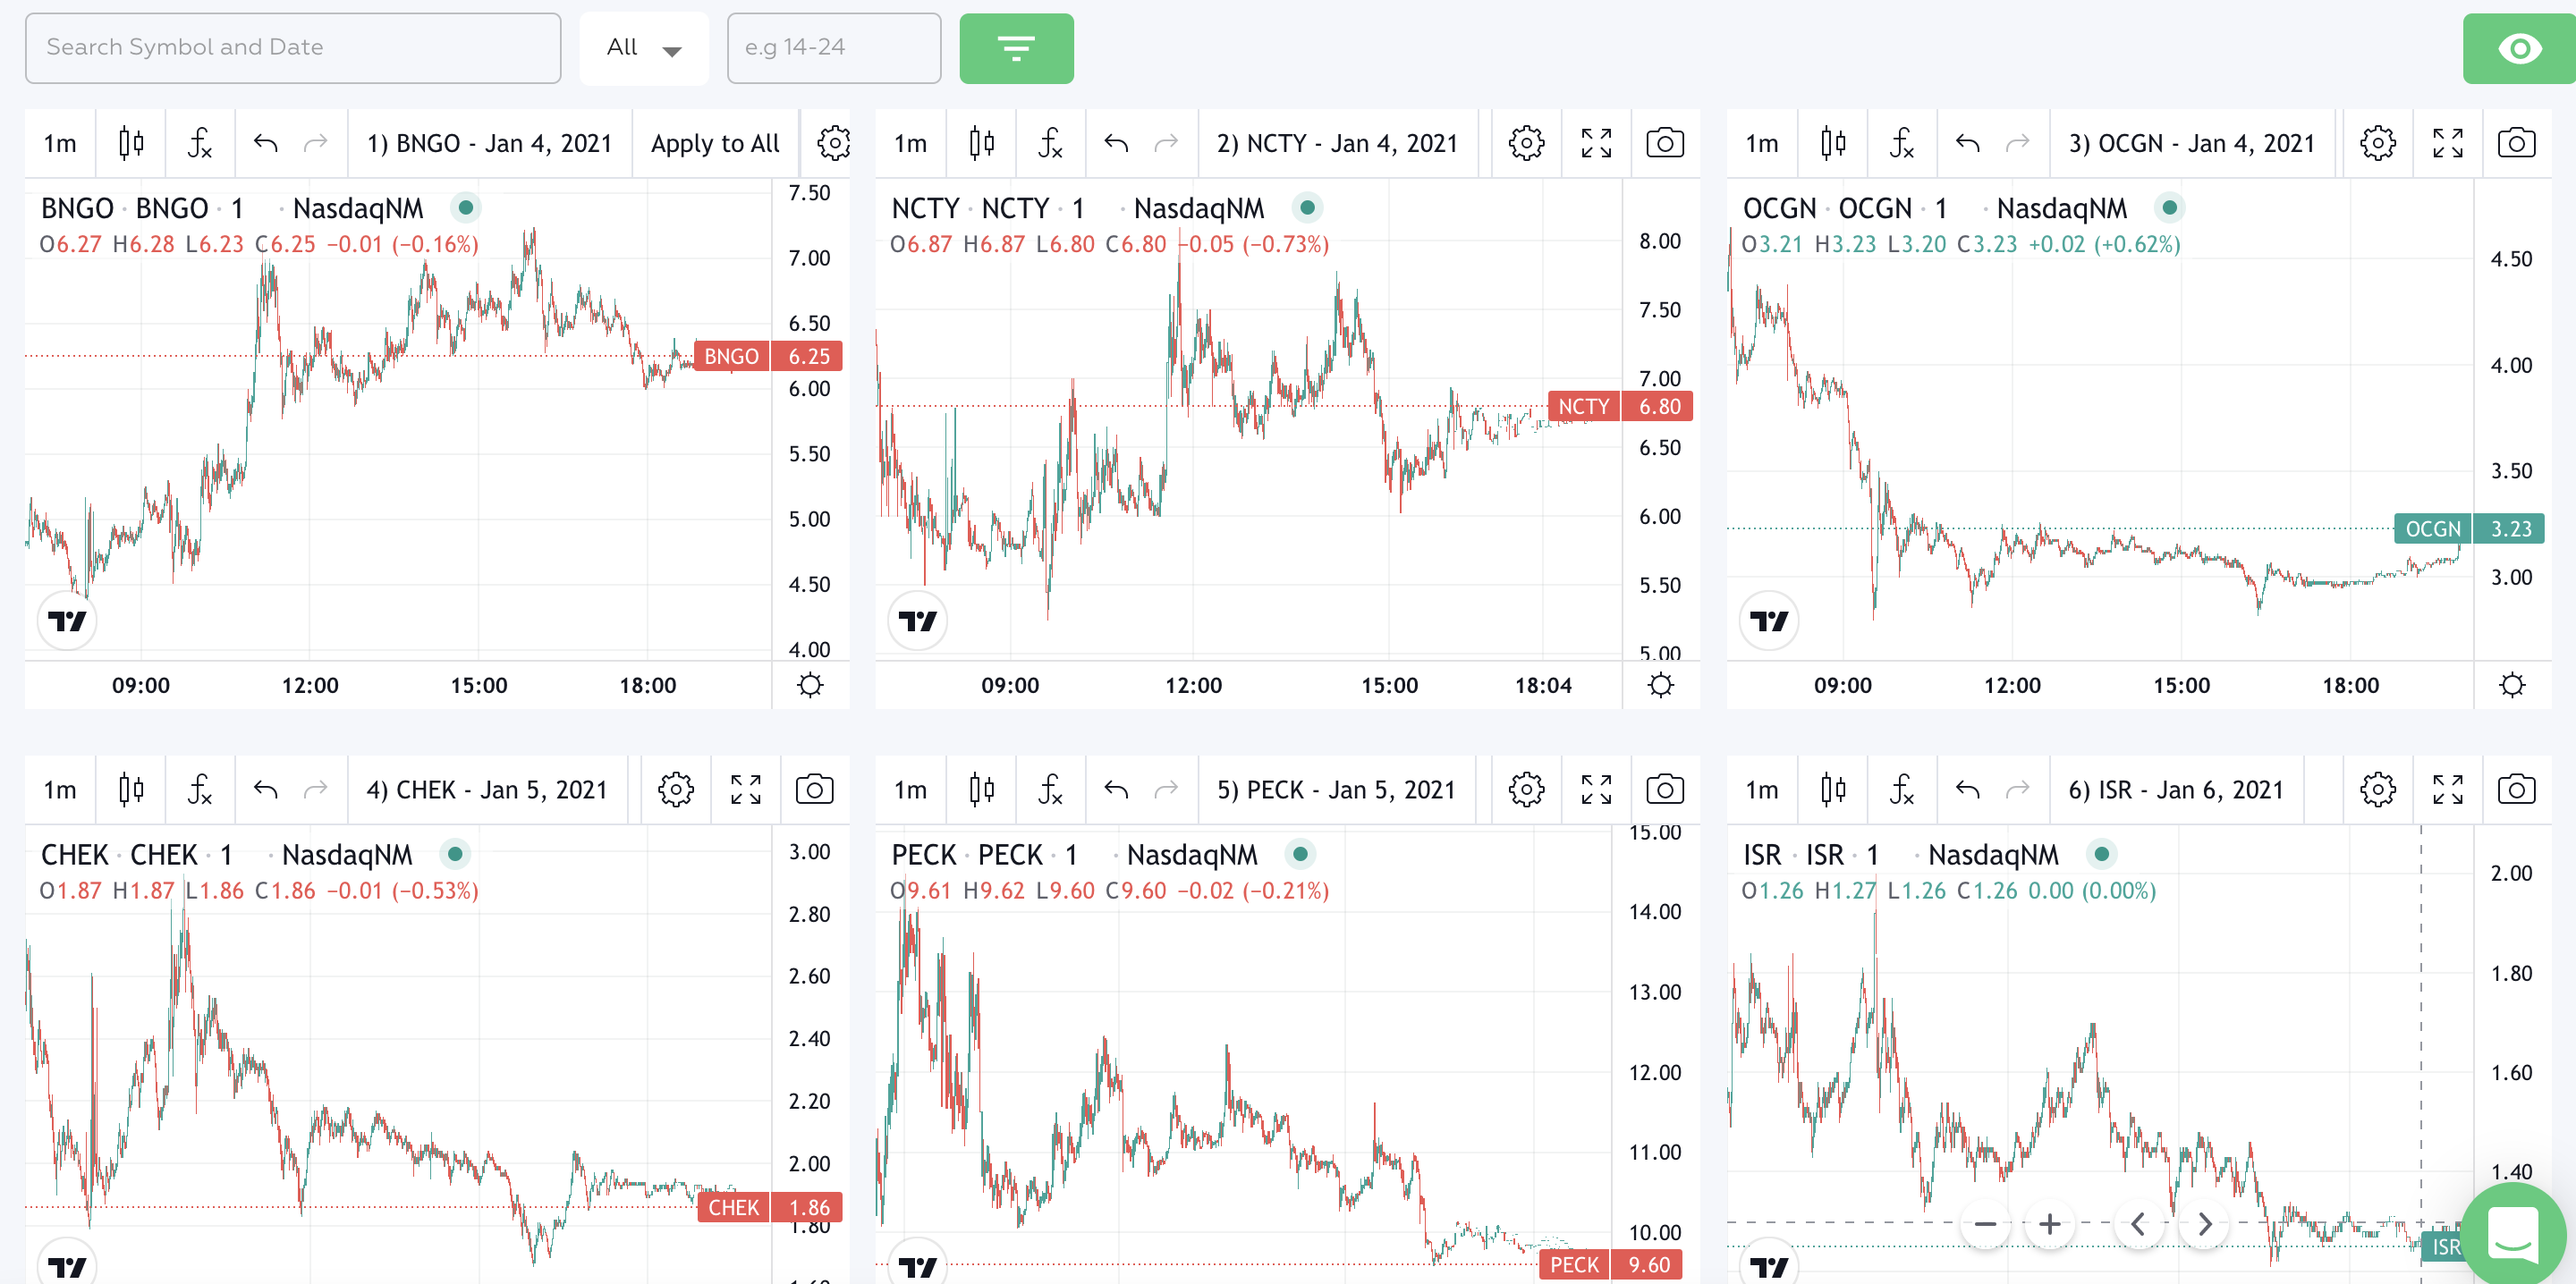
The charts are linked to all of your results that were populated in the spreadsheet.
Input your criteria to pull historical data into spreadsheets, with our no-code platform.
After successfully populating data into your spreadsheet the platform will render charts for your results.
if your data scan populated 10K tickers - you'll be able to stream 10K charts all at once and from 1 place!
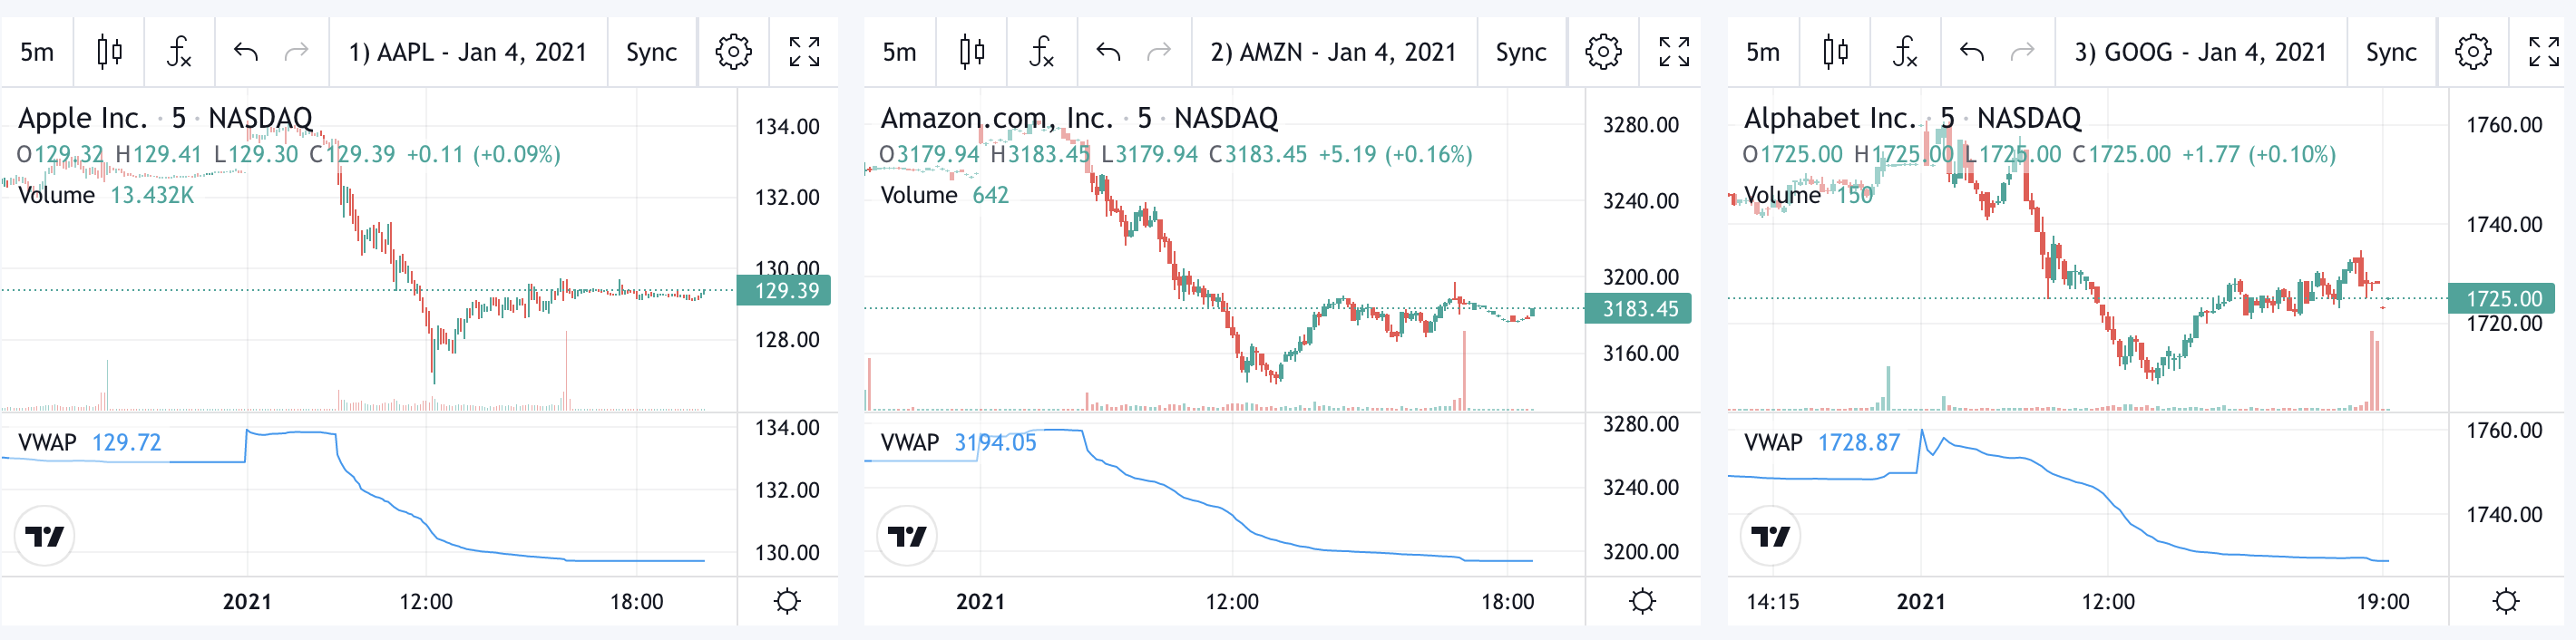
Add your indicators and studies across all charts
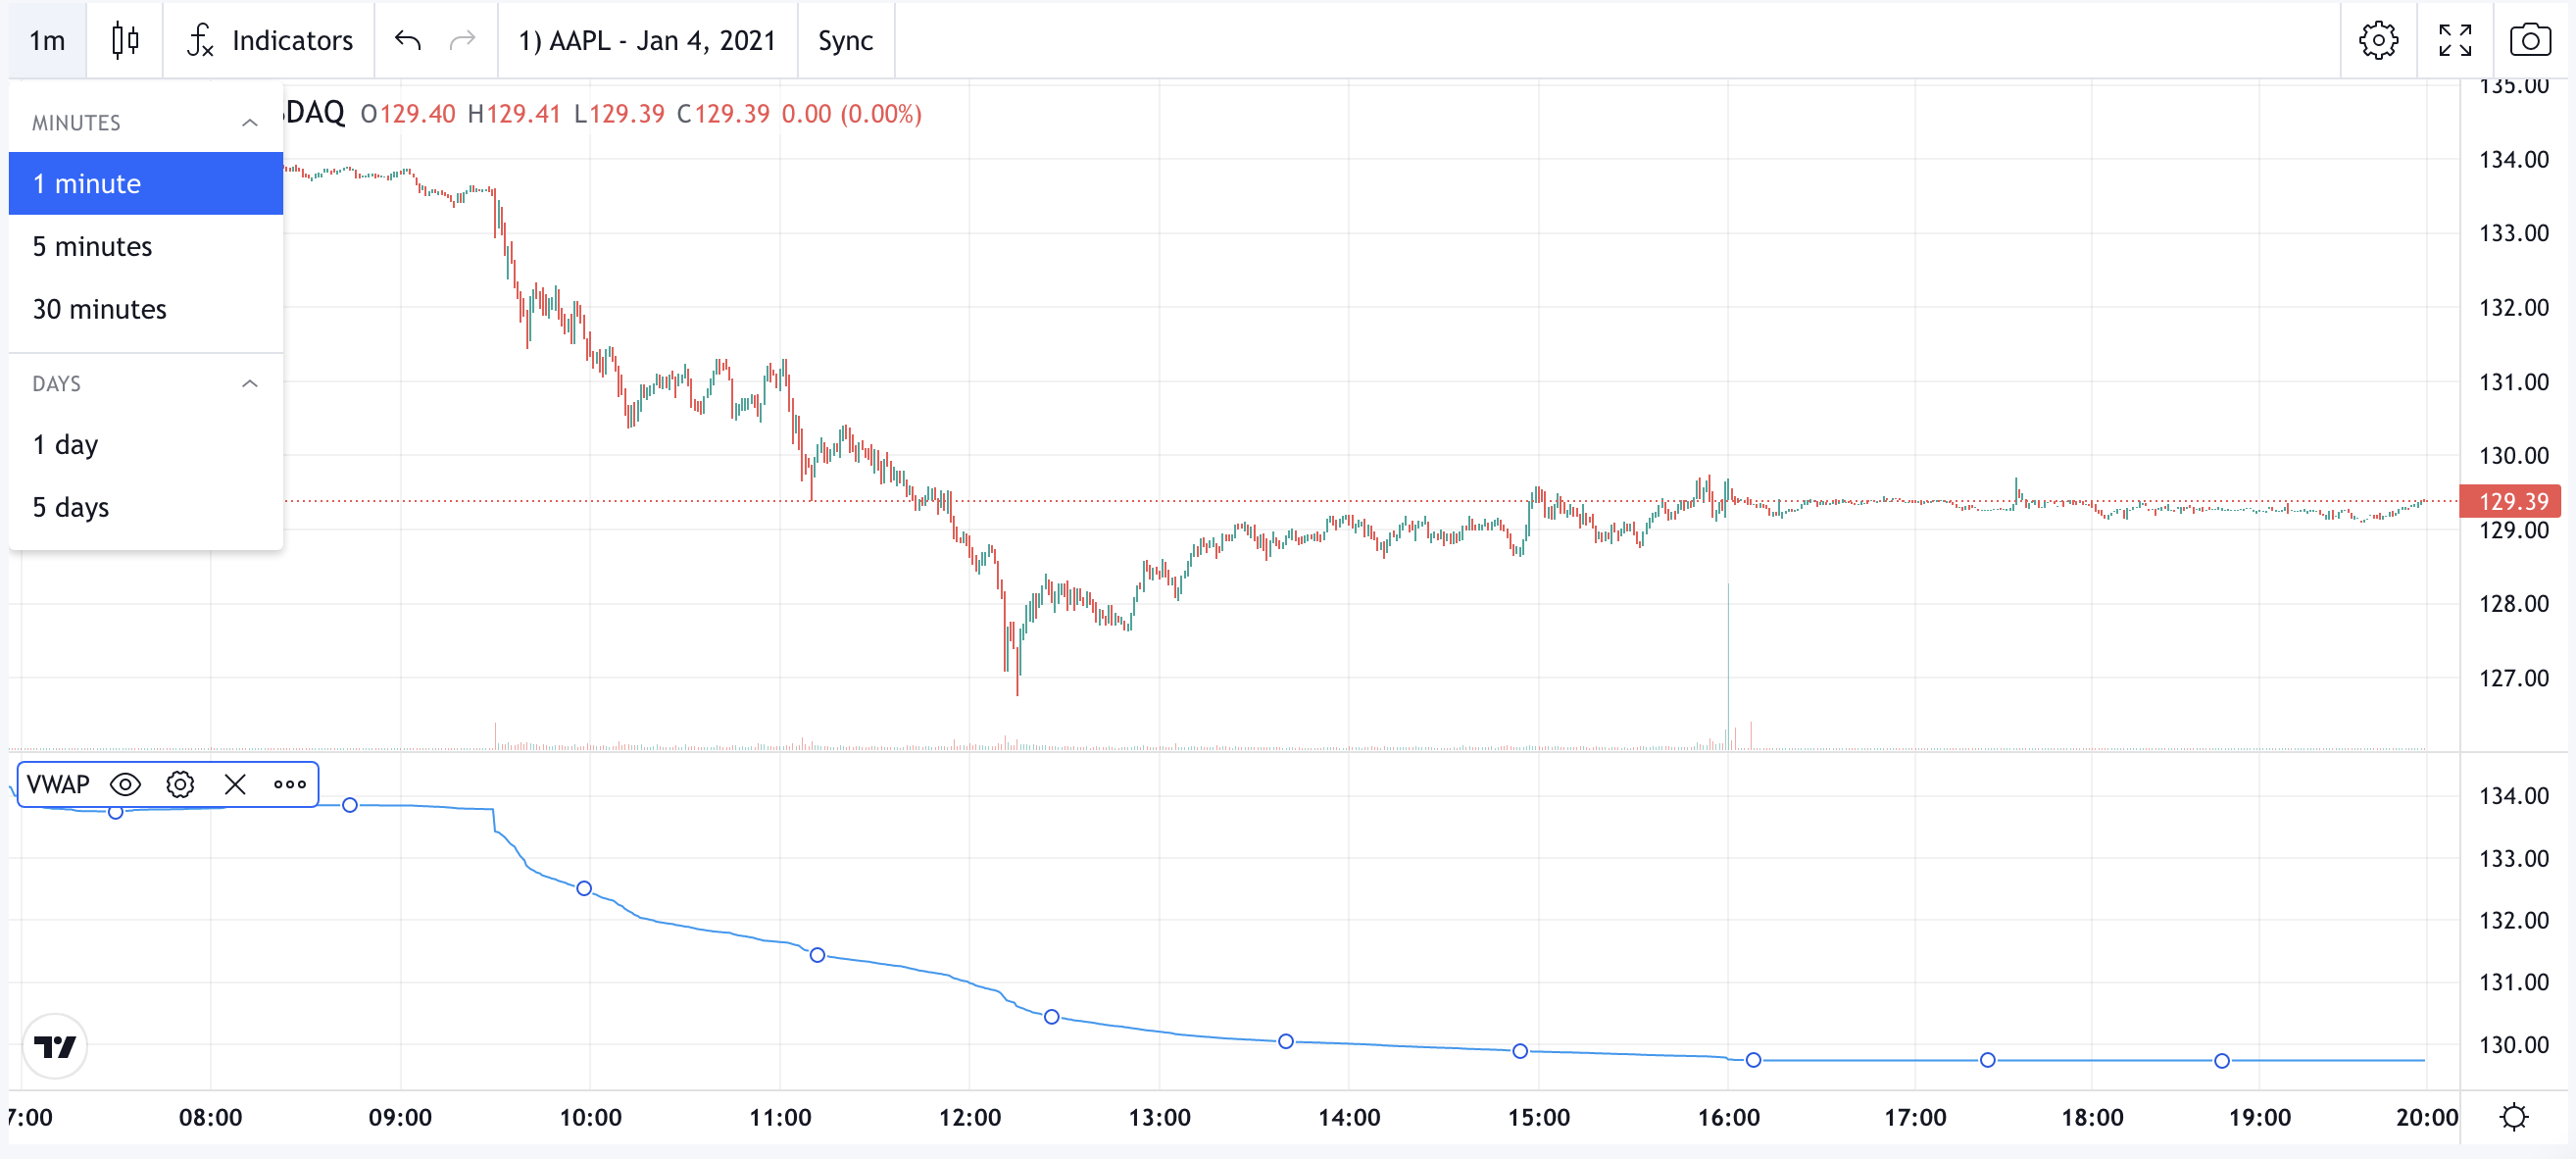
Add as many Indicators as you need such as VWAP or the 20MA, and adjust the chart to any time frme like the 1-minute chart, the 5min or the Daily chart.
After analyzing your charts and adding your indicators sync all settings across hundreds of charts.
Run your historical data scans and view all of your linked charts!